Enhancing K8s Observability: API Server Tracing Feature Upgraded to Beta
Author: mengjiao-liu
In a distributed system, it is difficult to determine where the problem lies. Imagine a scenario that Kubernetes cluster administrators encounter most frequently: pods cannot start normally. In this case, as an administrator, we first consider which component may have a problem and then search for logs in the corresponding component, only to find that the problem may be caused by another component. Then we go to search for other logs again. This is the best case scenario when we can find clues through the logs. Sometimes, the clues are not so obvious and we may need to ponder over where the problem lies. Sometimes, we need to rely on guesswork and spend a lot of time locating the problem. At this point, the administrator needs to have a fairly comprehensive understanding of each component of the cluster, which makes the cost of learning and troubleshooting high. In this case, if we have distributed tracing, we can clearly see which component has an exception and quickly locate the problem area.
Distributed systems often have uncertain problems or are too complex to replicate locally. Tracking what happens when requests flow through the distributed system makes debugging and understanding the distributed system less daunting. Distributed tracing is a tool designed to help in these situations, and the Kubernetes API server may be the most important Kubernetes component that can be debugged.
In Kubernetes, the API Server is the core component responsible for managing and scheduling all cluster resources. It receives and processes requests from various clients and converts them into underlying resource operations. Therefore, the stability and observability of the API Server are crucial to the overall health of Kubernetes.
To improve the observability of the Kubernetes API Server and help administrators better manage and maintain Kubernetes clusters, Kubernetes introduces APIServer Tracing, which adds more tracing information in the Kubernetes API Server and collects it into the backend collector. With this tracing information, administrators can more easily trace the origin and flow of requests, understand the processing time and results of requests, and thus more easily discover and solve problems. This information can also be used for performance optimization and capacity planning.
Next, let's take a closer look at this feature.
Kubernetes API Server Tracing
Design details: KEP APIServer Tracing #647
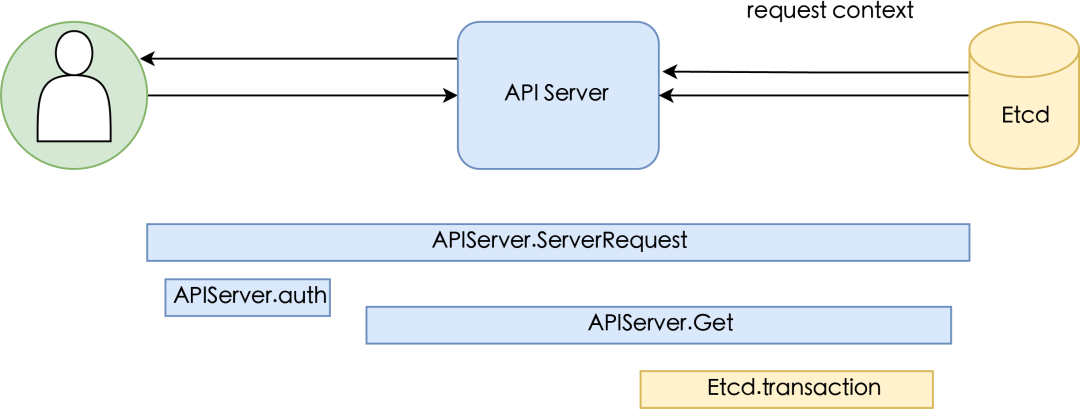
Overview of Tracing Diagram

Enabling
- APIServerTracing feature gate (not required from v1.27+)
- tracing-config-file configuration file
Status
Responsible team: SIG instrumentation
Iterative versions: 1.22 alpha, 1.27 reached beta version
Traced components: API → etcd tracing
Demo
Steps:
- Start Jaeger
- Start APIServer tracing (including starting etcd)
- Observe tracing in Jaeger UI
Start Jaeger Container
Jaeger is a popular distributed tracing UI tool and the 7th top-level project hosted by the Cloud Native Computing Foundation (CNCF) (graduated in October 2019). Here we choose Jaeger as the backend for data collection and storage, as well as the UI for visualizing data. jaegertracing/all-in-one is an executable designed for quick local testing, which can start Jaeger UI, collectors, queries, and proxies with memory storage components.
docker run -d --name jaeger \
  -e COLLECTOR_ZIPKIN_HOST_PORT=:9411 \
  -e COLLECTOR_OTLP_ENABLED=true \
  -p 6831:6831/udp \
  -p 6832:6832/udp \
  -p 5778:5778 \
  -p 16686:16686 \
  -p 4317:4317 \
  -p 4318:4318 \
  -p 14250:14250 \
  -p 14268:14268 \
  -p 14269:14269 \
  -p 9411:9411 \
  jaegertracing/all-in-one:1.43
Details: https://www.jaegertracing.io/docs/1.43/getting-started/
Start Kubernetes API Server Tracing
There are two ways to test starting Kubernetes APIServer tracing in this article. If you are a Kubernetes developer, you can test it directly in the Kubernetes interactive test; if you are a Kubernetes cluster administrator, you can configure relevant parameters directly in the cluster.
Start Kubernetes Local Interactive Testing
Test file: test/integration/apiserver/tracing/tracing_test.go
Modify API Server Tracing Test Code and Configuration
The local interactive test code needs to modify the configuration to send the collected data to Jaeger.
#test/integration/apiserver/tracing### Update Configuration for Jaeger Backend

```go
#test/integration/apiserver/tracing/tracing_test.go:125

if err := os.WriteFile(tracingConfigFile.Name(), []byte(fmt.Sprintf(`
apiVersion: apiserver.config.k8s.io/v1beta1
kind: TracingConfiguration
samplingRatePerMillion: 1000000
endpoint: %s`, "0.0.0.0:4317")), os.FileMode(0755)); err != nil {
  t.Fatal(err)
 }
Start etcd
The required configuration parameters are as follows:
--experimental-enable-distributed-tracing=true
--experimental-distributed-tracing-address=0.0.0.0:4317
--experimental-distributed-tracing-service-name=etcd
Modify the code as follows:
#test/integration/framework/etcd.go:82
customFlags := []string{
  "--experimental-enable-distributed-tracing",
  "--experimental-distributed-tracing-address=0.0.0.0:4317",
  "--experimental-distributed-tracing-service-name=etcd",
 }

currentURL, stop, err := RunCustomEtcd("integration_test_etcd_data", customFlags, output)
Run Tests
Configure API Server Tracing in a Kubernetes Cluster
Here we take a Kubernetes cluster installed with kubeadm as an example.
Configure the feature gate APIServerTracing=true in the kube-apiserver.yaml configuration file (this feature gate is no longer necessary in versions 1.27 and above).
Configure the tracing-config-file file and save it to /etc/kubernetes/apitracing-config.yaml.
apiVersion: apiserver.config.k8s.io/v1beta1
kind: TracingConfiguration
endpoint: 10.6.9.3:4317
samplingRatePerMillion: 100000 #Set the sampling frequency according to your needs
vim /etc/kubernetes/manifests/kube-apiserver.yaml
spec:
  containers:
  - command:
    - kube-apiserver
    - --feature-gates=APIServerTracing=true
    - --tracing-config-file=/etc/kubernetes/apitracing-config.yaml
Save and exit. kubelet will automatically restart APIServer.
Configure the following parameters in the etcd.yaml configuration file:
vim /etc/kubernetes/manifests/etcd.yaml
spec:
  containers:
    - command:
        - etcd
        - --experimental-distributed-tracing-address=<JaegerIP:4317>
        - --experimental-distributed-tracing-service-name=etcd
        - --experimental-enable-distributed-tracing=true
Save and exit. kubelet will automatically restart etcd.
View Jaeger
Now we can access Jaeger at http://

The green line is from the API server, including a service request to /api/v1/nodes and a grpc Range RPC sent to ETCD. The yellow line is from ETCD processing the Range RPC.
Conclusion
SIG instrumentation is actively promoting traceability of Kubernetes components. Currently, both APIServer Tracing and kubelet Tracing have reached Beta version in Kubernetes v1.27. Stay tuned!